RATIO USER MANUAL
Statistics: period, current position and trend
The Statistics page separates three questions: what happened over a period, how the current month is progressing, and how your finances change over time. The active workspace and the history available on your plan determine which data appear. Custom categories flow into macro groups through their chosen parent, including for historical transactions.
Period
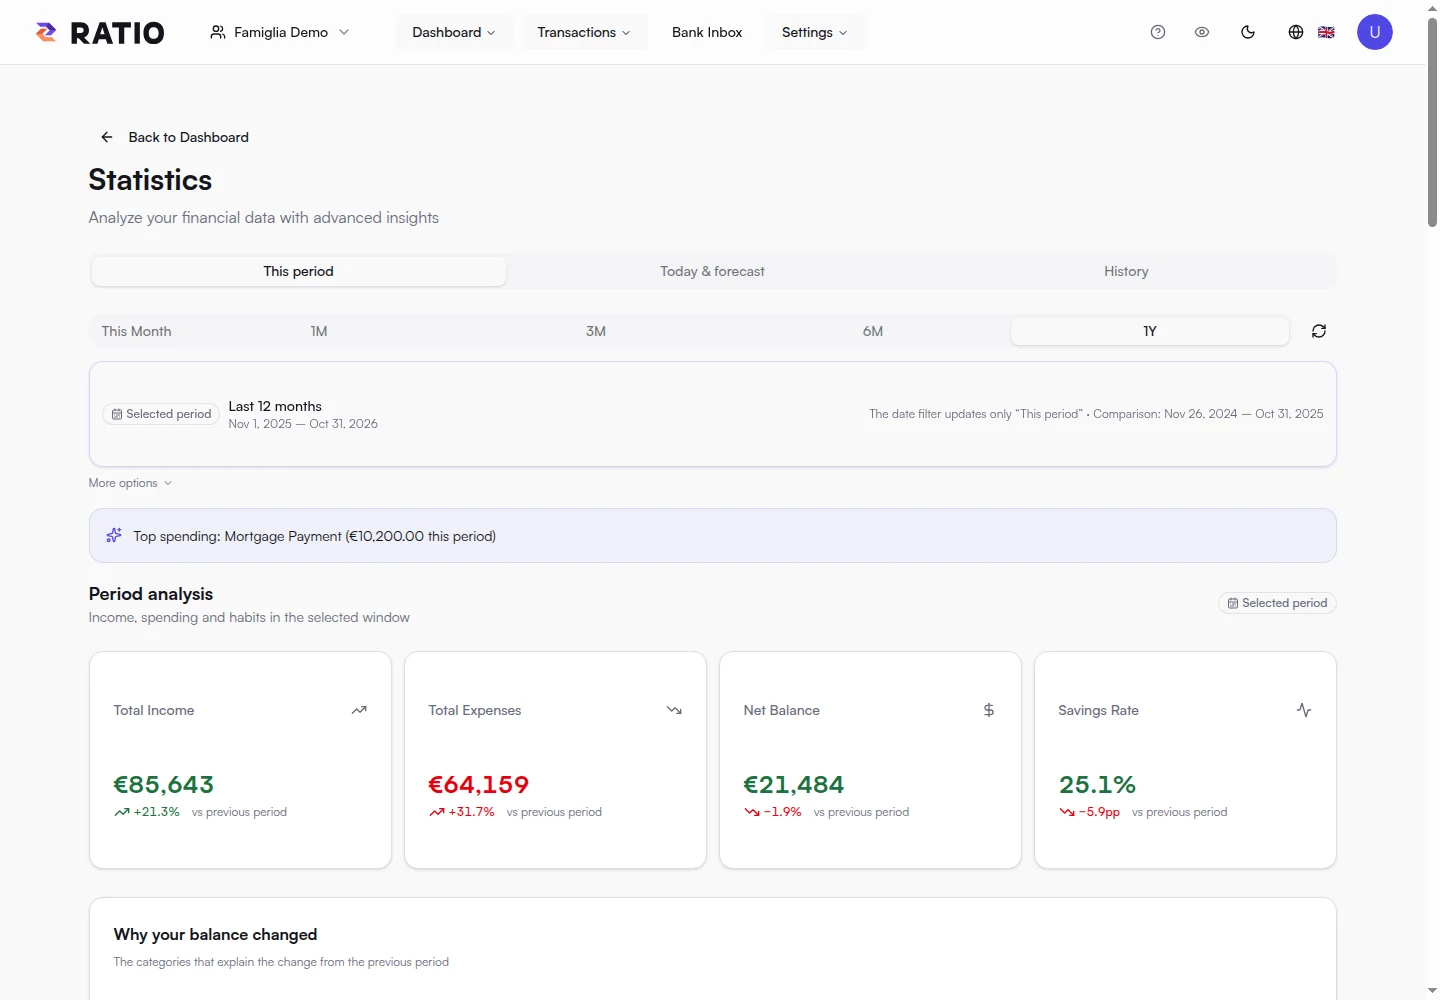
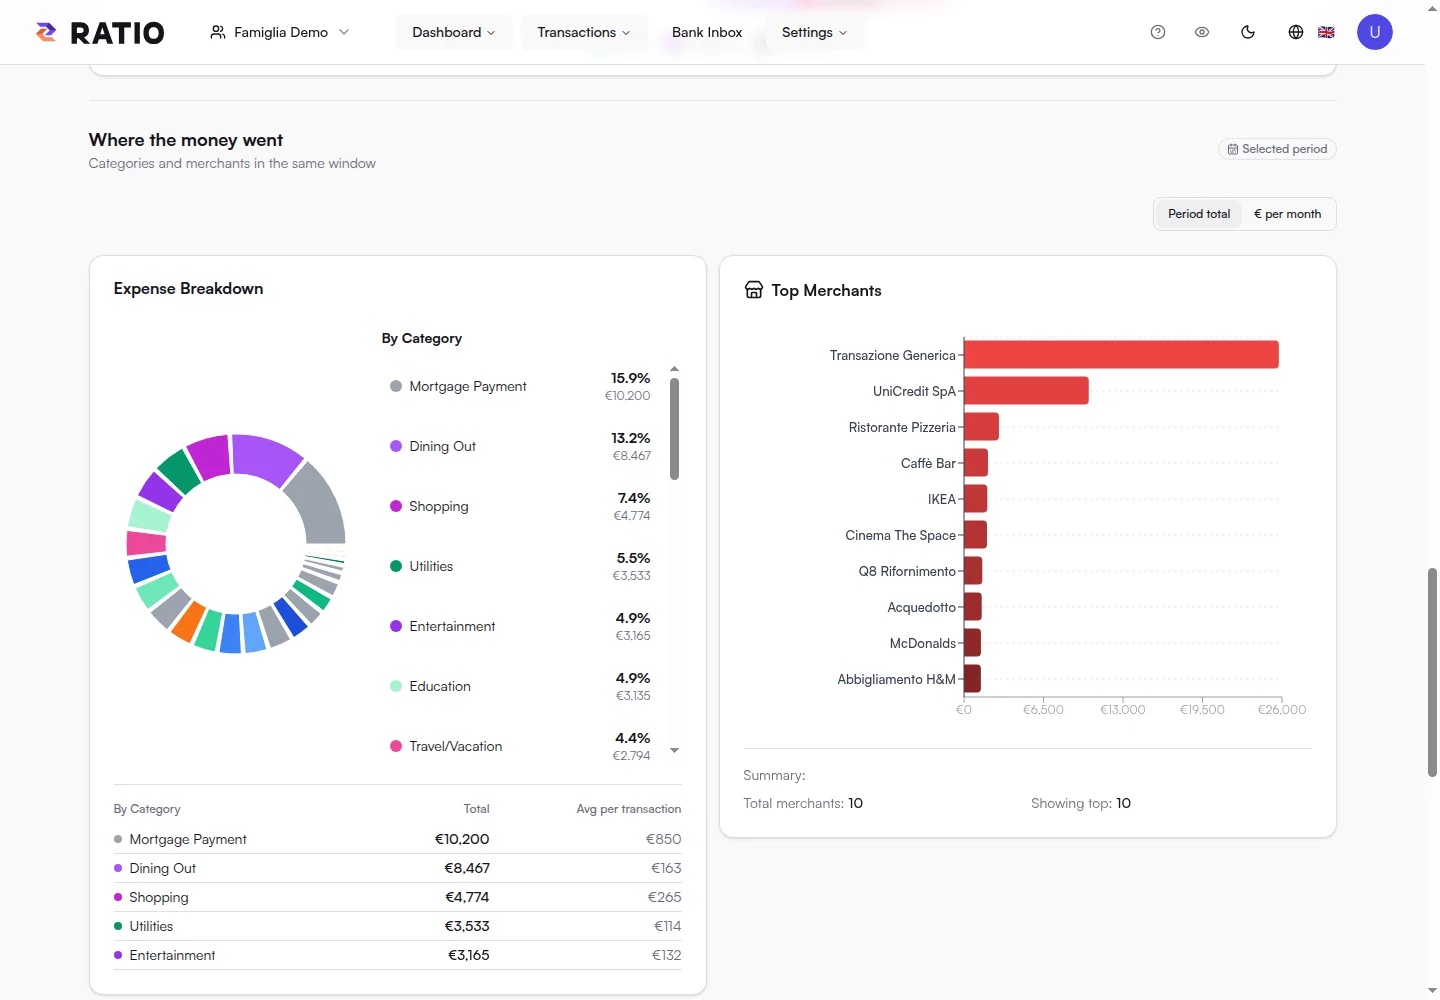
Open Period and choose the current month, previous month, 3 months, 6 months or 1 year. Start with income, expenses and net balance, then look at categories, flows and leading merchants. The chosen period applies to the period analysis; other cards with their own time labels may refer to the current month or recent history.
Spending statistics separate transfers and investments from everyday outgoings. A transfer between your own accounts is not a new expense. Buying securities is not the same as buying groceries. Assign the right category to read consistent indicators.
Sankey and detailed categories
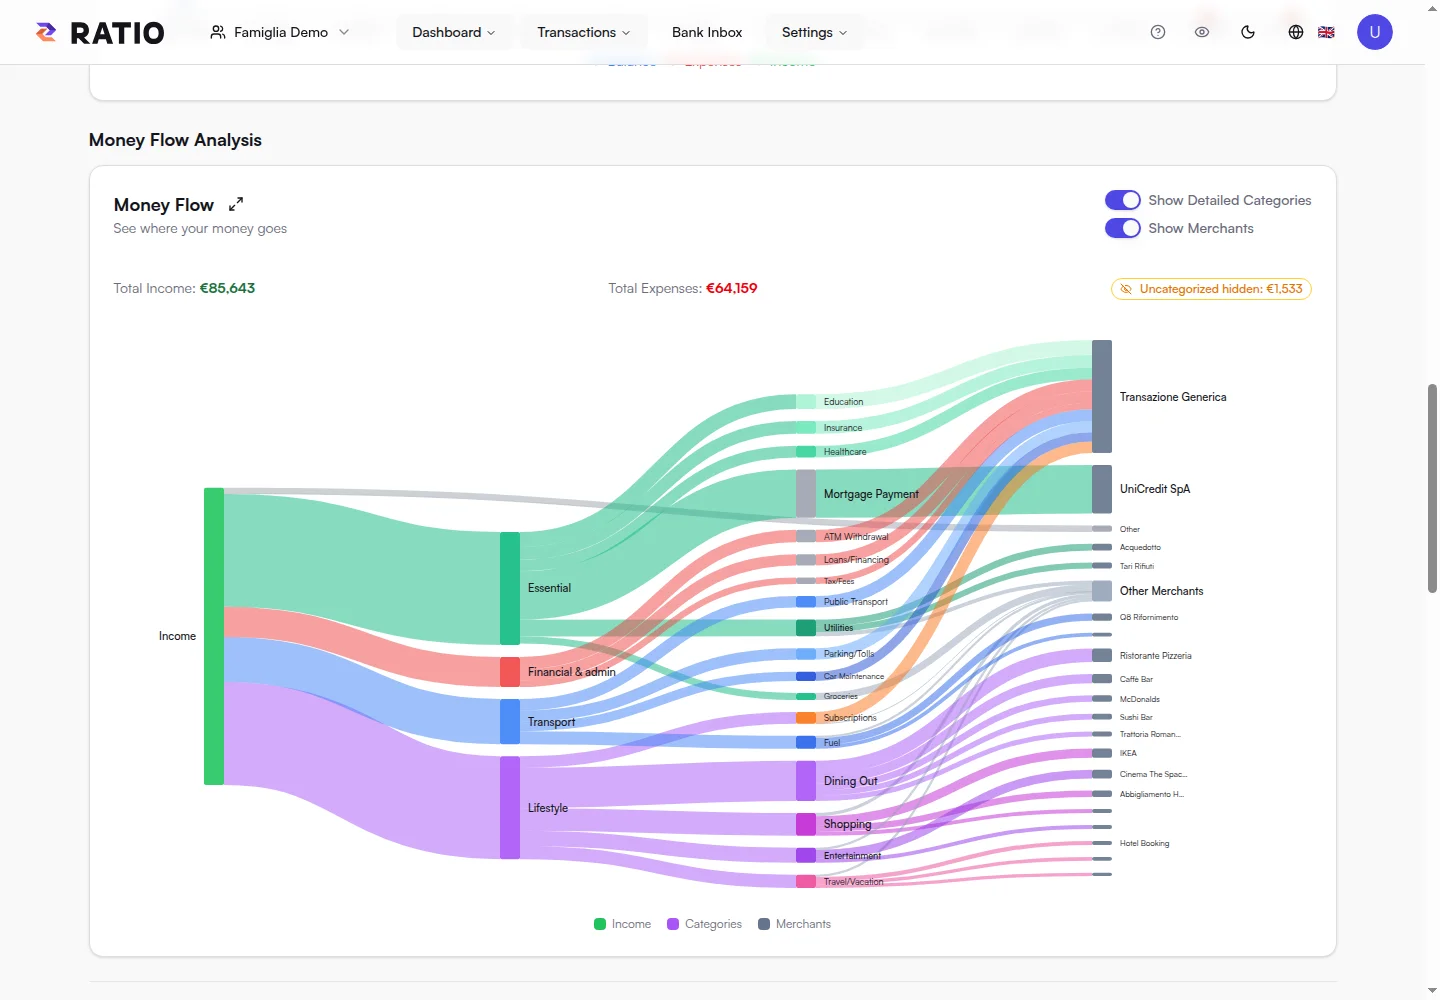
The Sankey chart shows how amounts flow from income into spending groups. Enable detailed categories to see individual classifications and merchants to follow flows toward recipients. These controls change chart detail; they do not create transactions.
For example, Padel can be a child of Sports, within Entertainment and the Lifestyle macro group. Padel remains distinct in the detailed view; in the macro view its amounts contribute to Lifestyle. A small flow grouped in the chart has not been deleted from your transactions.
Cash flow and accrual
Cash flow describes income and outgoings over time; monthly groupings use accrual shares when you have set them. A €300 expense accrued over three months is divided into three €100 shares. Without an accrual period, Ratio uses the transaction date. Some short periods use weekly groupings: check the chart labels.
A period's net flow is not necessarily your bank balance. It depends on the available transactions, the period and the exclusions applied. Before comparing two numbers, check that they describe the same data and time range.
Today, budgets and forecasts
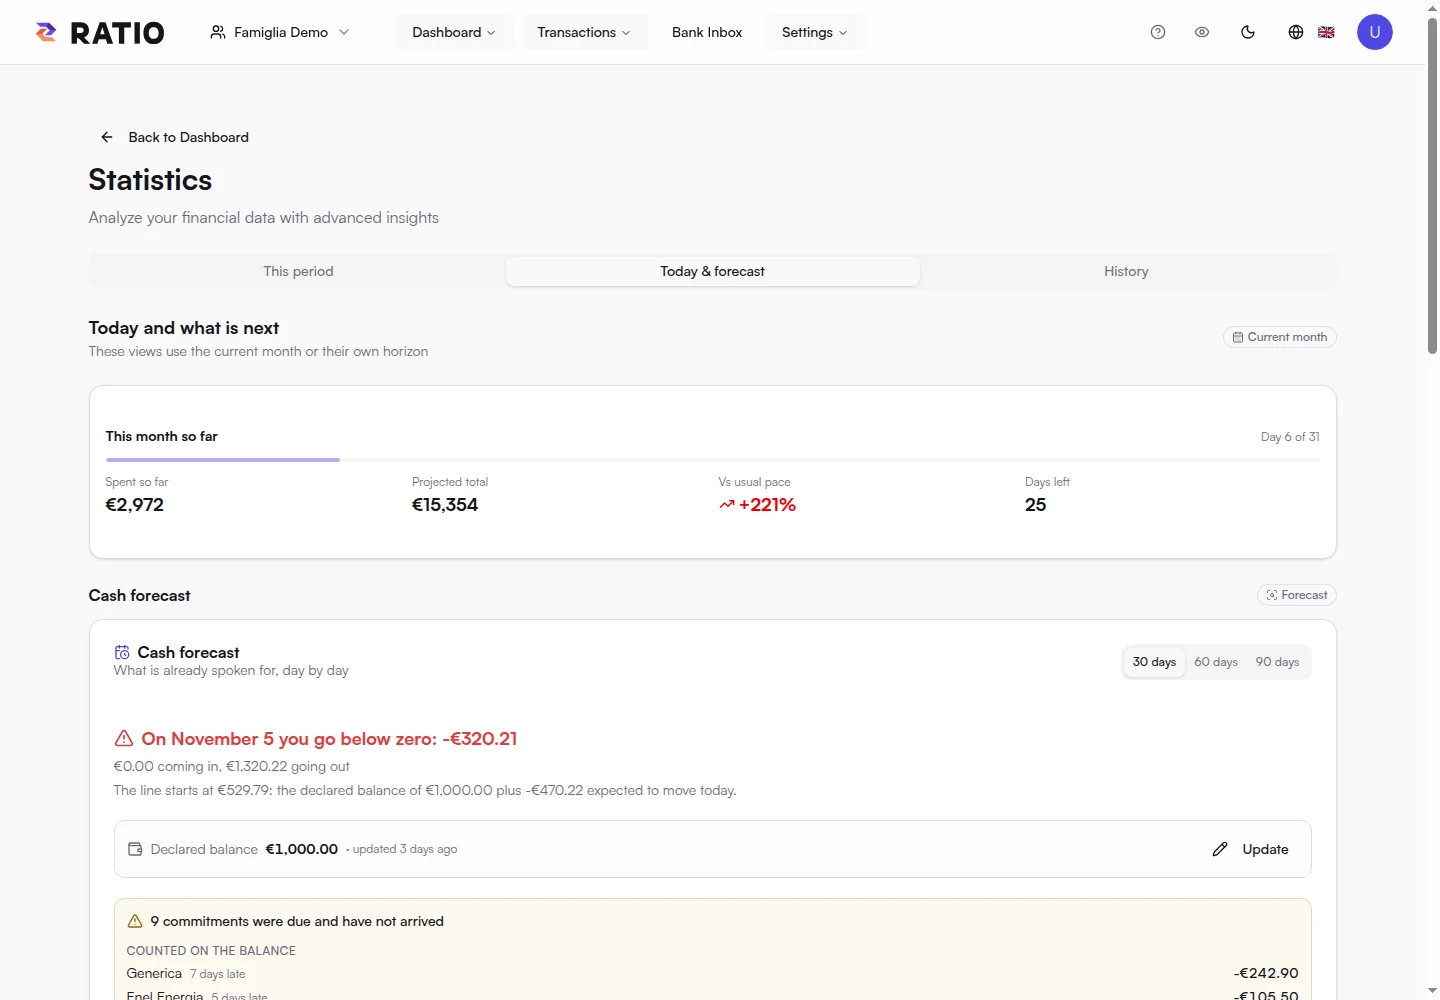
Today focuses on the current month: spending velocity, forecasts, budgets and resilience indicators. A forecast uses observed data and detected commitments; it cannot guarantee future results. If history is short or out of date, treat the estimate with more care.
Create a budget for a category and set a monthly limit. A parent budget includes its descendants: Sports includes Padel. You can keep parent and child budgets to inspect different levels; overall coverage avoids counting the same expense twice. Hiding a category from selectors does not remove it from budgets.
The emergency-fund view describes how much average spending your available resources could cover, according to the fields it uses. Recurring detection estimates cadence from transaction patterns: check each result before relying on it as a commitment. Financial health indicators summarize your data; they do not replace your own assessment.
History
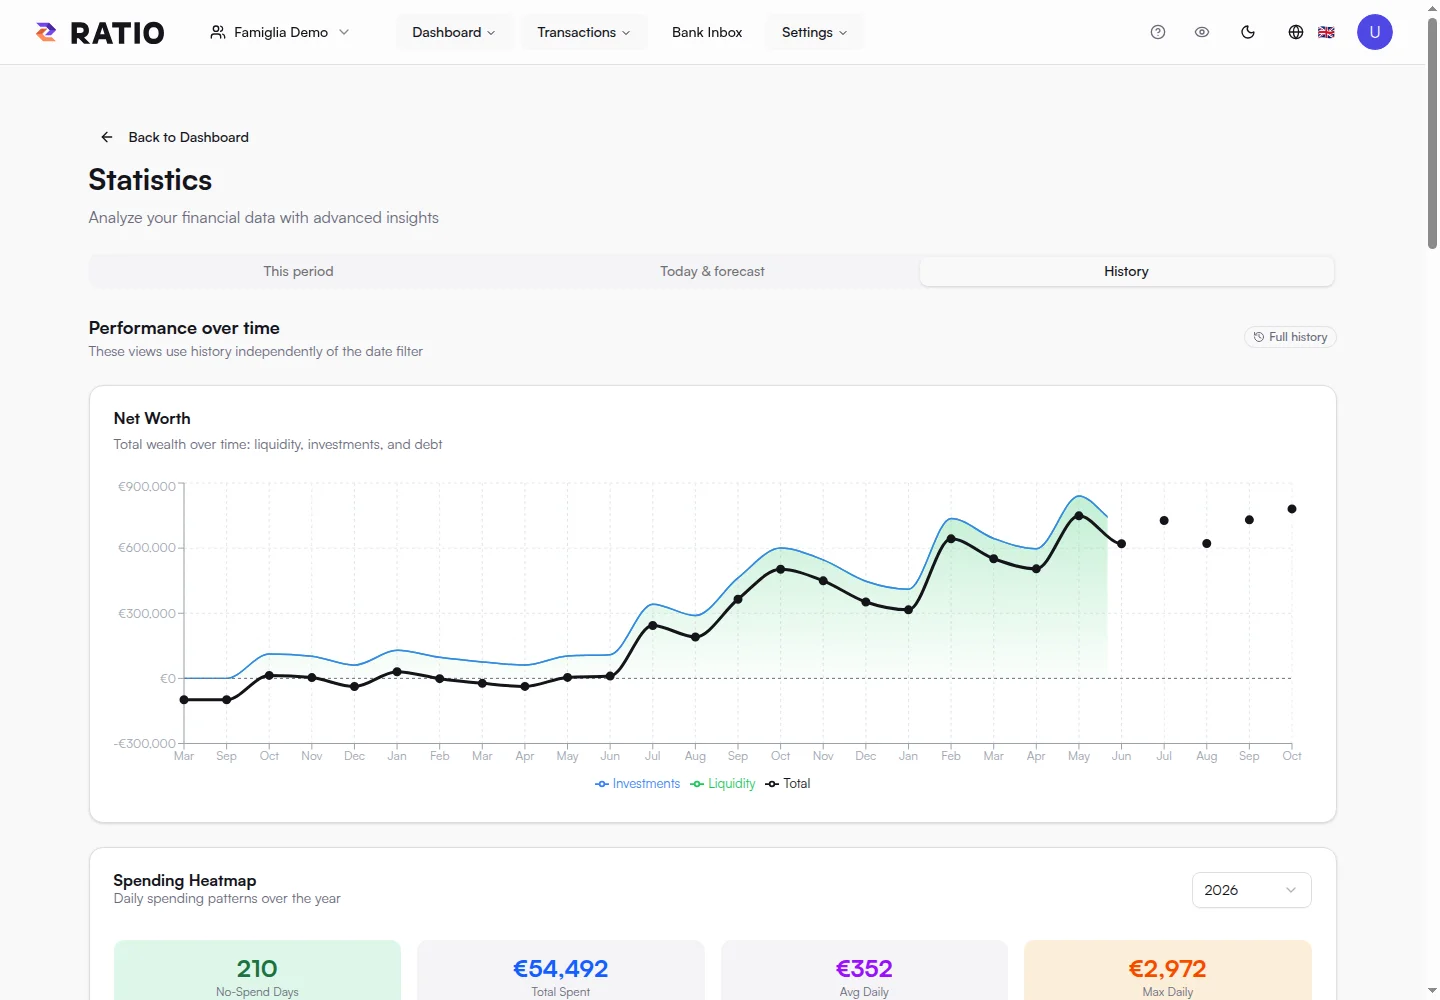
Use History to review trends and comparisons. Read the time-range labels carefully: complete months are different from comparing a finished month with a few days of the current month. A recent import can add or correct earlier months, changing the chart without new spending.
If data are missing, check imports, sync, categorization and the history available on your plan. Data encrypted on the server and results currently available to your client are not the same thing.
Screenshots